“There are decades where nothing happens, and then there are weeks where decades happen.” Vladimir Lenin. 2016 had two big weeks that changed how we view the world. Britain voted to exit the Eurozone in June, which could have a domino effect and see other countries leaving too. Donald Trump got elected President of America; with certain policies that could spark economic growth and others that can take us back 20 years.
| Asset Class | Currency | 1 Month | 3 Month | 2016 YTD | 2015 |
| Local Equity | ZAR | 1.0% | -2.1% | 2.6% | 5.1% |
| Local Bonds | ZAR | 1.5% | 0.3% | 15.4% | -3.9% |
| Local Property | ZAR | 4.2% | 1.3% | 10.2% | 8.0% |
| Local Cash | ZAR | 0.6% | 1.9% | 7.4% | 6.5% |
| Resources | ZAR | -3.6% | -1.2% | 34.2% | -37.0% |
| Industrials | ZAR | 1.8% | -4.7% | -6.5% | 15.3% |
| Financials | ZAR | 3.5% | 2.9% | 5.4% | 3.9% |
| R/US Dollar | 2.5% | 0.6% | 11.7% | -33.9% | |
| R/Pound | 3.6% | 5.4% | 26.0% | -26.6% | |
| Global Equities | USD | 2.2% | 1.2% | 7.9% | -2.4% |
| Emerging Market Equities | USD | 0.2% | -4.2% | 11.2% | -14.9% |
| Local Equity | USD | 1.0% | -2.1% | 2.6% | 5.1% |
Source: PortfolioMetrix, Bloomberg Local equities were hit by a strengthening Rand and ended the quarter 2.1% lower with a dismal return of only 2.6% for 2016. Local bonds were the shining light recovering from the shenanigans of December 2015 when Finance Minister Nene was fired. Bonds further strengthened as we avoided a credit ratings downgrade in December. Bonds were up 15% in 2016. In dollar terms, we saw positive returns over the year with emerging markets recovering from a torrid 2015 up 11% in 2016.
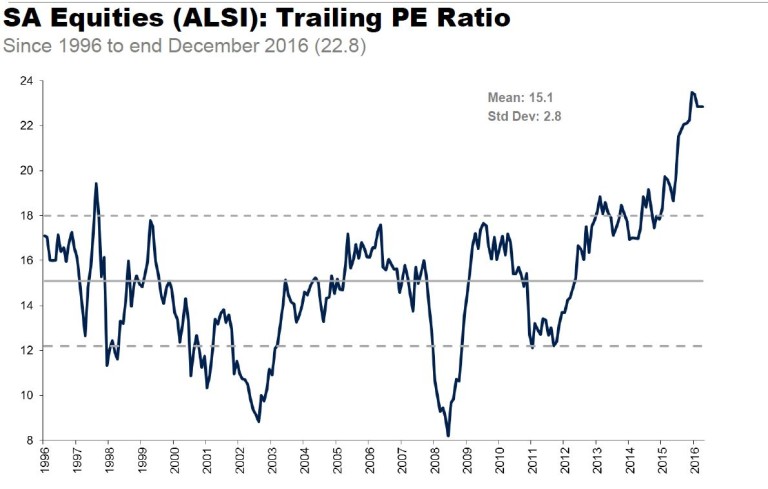
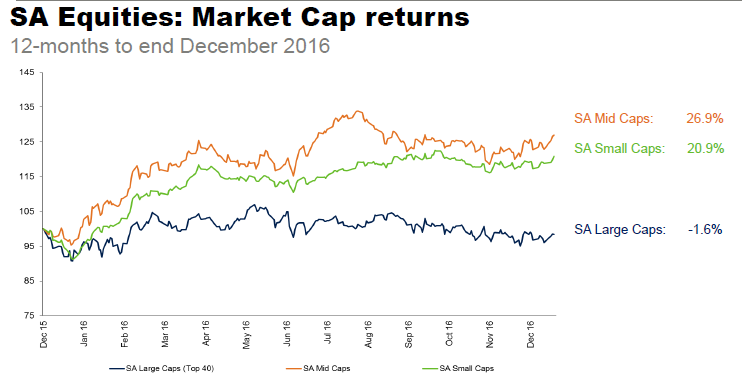
Source: I-Net Bridge The market P/E as shown above indicates that the JSE All Share Index is expensive at current levels trading at a P/E of 22.8. However, half of this index consists of the 10 biggest companies. Of those, Naspers makes up the biggest portion comprising of 14%. Naspers is currently trading at a P/E multiple of 77. The Top 10 resource companies are trading at a P/E of 30. This is mainly due to depleted earnings figures published last year. If we look at the Top 15 financial stocks on the market, their P/E is only 13. Although the market as a whole might look expensive, there are definitely stocks out there that are more affordable. Stock selection will be more important than usual. From the graph below it is interesting to note that small and medium size firms on the JSE had an excellent year recovering from the losses of 2016. Performance was boosted by the recovery in the resource sector that was up 34% at year-end. Large shares were mainly pulled down by the big Rand hedge firms ending in the red.
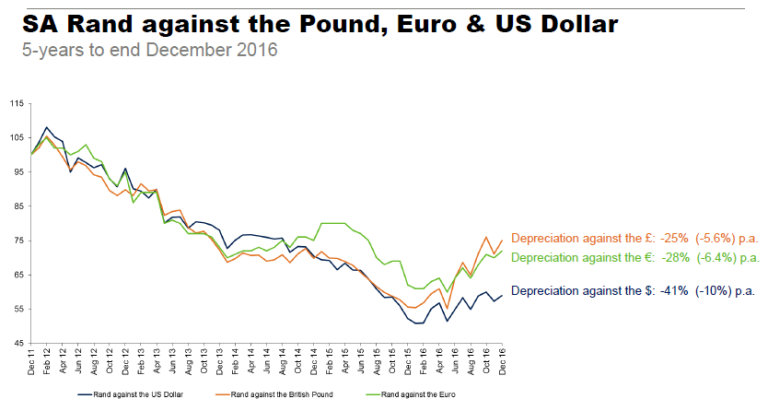
Source: I-Net Bridge, Investec The Rand strengthened against all major currencies in 2016. The graph below illustrates the 5-year movement of the Rand. With SA inflation in a long-term range of 5-6% in comparison with major economies between 0 – 2%, the long-term trend will always be a weakening Rand. Although political events might cause big shifts in the currency it tends to revert to fair value.
Source: I-Net Bridge, Investec Inflation for the year was at 6.8% mainly driven by food inflation that was above 11%. Inflation is expected to come back under the 6% threshold this year. This is mainly driven by food inflation that is expected to subside as the improved rainfall is expected to increase the maize production. It is also expected that there will be no hike in interest rates by the Reserve Bank should inflation pressure ease. The graph below illustrates these projections. 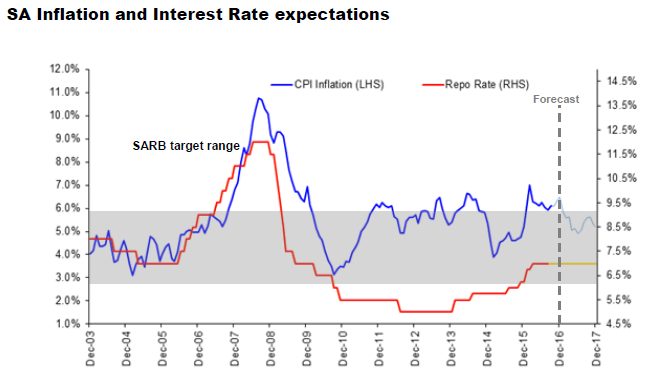
Source: PortfolioMetrix On November 8, 2016, the United States of America had their elections. In yet another shock result Donald Trump was elected President ahead of the favourite, Hilary Clinton. US equity markets reacted positively to the news. This is mainly driven by promises to reduce corporate tax and implement stricter policies on imports to increase competitiveness on US soil as well as increased spending on infrastructure. Trump’s “America First” push is unprecedented and unknown. How this policy will be implemented and how corporates and the rest of the world will react to this policy shift, heightens uncertainty. Continuing on the global front, Theresa May was pushing for what is described as a hard Brexit. This was met with strong resistance from parliament. The UK has set a deadline of 30 March 2017 to trigger Article 50 of the Lisbon Treaty. This story will develop rapidly in the coming months. There have been mixed market reactions since the referendum. Initially both the markets and the pound tumbled. The Pound has weakened considerably and lost 17% since the vote. This illustrates that a globally diversified equity market such as the UK’s, benefits from a weak pound. The doom and gloom over Brexit and the potential impact on the UK equity market is overrated. Even the FTSE250 (which is a better yardstick of the UK economy) has returned more than 4% since Brexit. 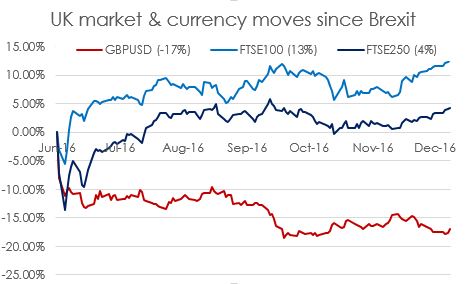
Source: Bloomberg In America, the Federal Reserve finally increased their interest rate with 0.25% as expected. Fed Chair, Yellen, has signaled further hikes in 2017 as the US economy improves. The most significant event in December happened when OPEC (Organization of the Petroleum Exporting Countries) agreed to cut production of oil for the first time in 8 years. Russia followed suit. This led to a significant jump in the oil price to above the $56 mark. Whether this deal will hold is difficult to forecast. The higher oil price would mean that US companies might start drilling again, which could lead to a surge in supply and dampen the current surge in the price. On the local front, the NEC led by Tourism Minister Derek Hanekom, pushed for a motion against President Zuma to step down. This was the first time the NEC, or at least some members, openly came out against the president. The Zuma camp rushed to have the motion dismissed. Expect the buildup to the ANC’s Leadership Conference and the battle for the heart of the party to create significant volatility this year. In December, our Treasury fought off a downgrade of our bonds to junk status. This was an incredible effort but we are not out of the woods yet. Ratings agencies will look to tighter fiscal policy in the Budget speech and improved growth when we are up for review again in June. The political changes that occurred in 2016 bring a fundamental shift in policies - and the extent of these will unfold over the coming months and years ahead. With the Netherlands, France and Germany heading to the polls throughout 2017 - we could see even more shifts. Campaigns might be formed around leaving the European Union and this might cause more uncertainty. With signs that the economic climate is improving in America - it could boost economic activity globally. Further Fed rate hikes and destructive policies on trade could potentially put a damper on emerging markets. So where does this leave us? In a diversified portfolio, there will always be asset classes that will perform and under-perform. The article below is an excellent read on how various asset categories have fluctuated from being the best to worst performers for a given year. http://www.moneyweb.co.za/investing/unit-trusts/so-you-think-you-can-pick-next-years-winning-fund/ Riskier assets are essential In the long-term having riskier assets such as equities in a portfolio - is essential to most investors to beat inflation. Just because local bonds outperformed in 2016 does not mean you should change your portfolio to include more of this asset class. Most investors are in it for the long run and need equities in their portfolios. Another common error in times like these is to keep too much cash until the uncertainty has blown over. After all, even cash beat equities last year. However, markets are always uncertain. By the time, markets are exuberant again, it will be too late and you are probably not going to get an average return. When the pain seems at its worst, it is definitely not the time to bail. Portfolios are probably underweight local equities due to the recent underperformance. This is a time to rebalance to the desired long-term weight, not to reduce local equities. Glossary P/E The price-earnings ratio (P/E Ratio) is the ratio for valuing a company that measures its current share price relative to its per-share earnings. The price-earnings ratio can be calculated as: Market Value per Share / Earnings per Share.
